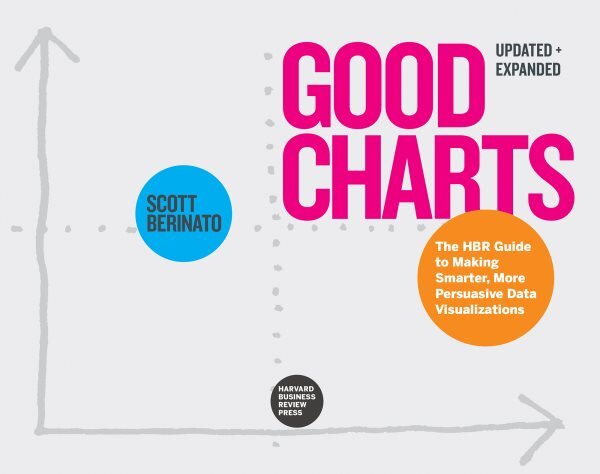
Good Charts, Updated and Expanded: The HBR Guide to Making Smarter, More Persuasive Data Visualizations Revised edition

Specifikacijos:
Autorius: Scott Berinato
Puslapių skaičius: 272
Leidimo metai: 2023
Prekės ID: 75265247
6765
8918
-24%
Pardavėjas: Minced 4.3
Į krepšelį
885 / mėn.
Skolinantis 6765 , sutartį sudarant 9 mėn. laikotarpiui, mėn. įmoka - 885 , metinė palūkanų norma - 21,60%, mėn. sutarties administravimo mokestis - 0.6%, sutarties sudarymo mokestis - 3%, BVKKMN - 48,71%, bendra vartojimo kredito gavėjo mokama suma - 7965 .
Paslaugos teikėjas: „AS Inbank filialas“.

3 2255
Be pabrangimo
Jūsų miestas

Vilniuje, parduotuvėje (Laisvės pr. 75)

Rugpjūčio 1 d.

000

Vilniuje, parduotuvėje (Upės g. 9 (PC „CUP“))

Rugpjūčio 1 d.

000

Kaune, parduotuvėje (K. Baršausko g. 66A, PC „Molas“)

Rugpjūčio 1 d.

000

Klaipėdoje, Šiauliuose, Panevėžyje, parduotuvėje

Rugpjūčio 2 d.

000

Atsiimkite Pigu terminale Vilniuje

Rugpjūčio 2 d.

199

LP EXPRESS terminale

Rugpjūčio 2 d.

219

Pristatysime į namus

Rugpjūčio 2 d.

349

Lietuvos pašto skyriuje

Rugpjūčio 5 d.

149

Atsiimkite Omniva paštomate

Rugpjūčio 5 d.

265

Smartpost terminale

Rugpjūčio 5 d.

269

Dėmesio! Pristatymo terminai yra preliminarūs, kadangi terminai atsinaujina priklausomai nuo faktinio užsakymo pateikimo ir apmokėjimo laiko. Galutinis pristatymo terminas yra pateikiamas Pigu.lt patvirtinus užsakymą.

Pardavėjas: Minced 4.3

Prekės aprašymas: Good Charts, Updated and Expanded: The HBR Guide to Making Smarter, More Persuasive Data Visualizations Revised edition

"The best, most powerful way to communicate the nature and potential impact of data is visually. For a long time "dataviz" was left to specialists-data scientists and professional designers. No longer. A new generation of tools and massive amounts of available data make it easy for anyone to create visualizations that communicate ideas far more effectively than generic spreadsheet charts ever could. The companies that invest in improving their visual communication will gain a competitive advantage, seeing threats and finding opportunities others don't. For individuals like you, building good charts is a need-to-have skill. If you're not doing it, other managers are, and they're getting noticed for it and getting credit for contributing to your company's success. In this updated and expanded edition of Good Charts, dataviz maven Scott Berinato provides the essential guide to how visualization works and how to use this new language to impress and persuade. Berinato lays out a system for thinking visually and building better charts through a process of talking, sketching, and prototyping. From tips and tricks for upping your visualization's clarity to laying out a system for storytelling with data, Good Charts covers all the core skills you need and can develop. This new edition includes added visuals and updates the landscape of visualization tools. It also includes new chapters on building dataviz teams and creating workflows to integrate visualization into everything you do. Good Charts is your go-to resource for turning plain, uninspiring charts and presentations that merely present information into smart, effective visualizations that powerfully convey ideas"--
The ultimate guide to data visualization and information design for business.Making good charts is a must-have skill for managers today. The vast amount of data that drives business isn't useful if you can't communicate the valuable ideas contained in that data—the threats, the opportunities, the hidden trends, the future possibilities.But many think that data visualization is too difficult—a specialist skill that's either the province of data scientists and complex software packages or the domain of professional designers and their visual creativity.Not so. Anyone can learn to produce quality "dataviz" and, more broadly, clear and effective information design. Good Charts will show you how to do it.In this updated and expanded edition, dataviz expert Scott Berinato provides all you need for turning those ordinary charts kicked out of a spreadsheet program into extraordinary visuals that captivate and persuade your audience and for transforming presentations that seem like a mishmash of charts and bullet points into clear, effective, persuasive storytelling experiences.Good Charts shows how anyone who invests a little time getting better at visual communication can create an outsized impact—both in their career and in their organization. You will learn:A framework for getting to better charts in just a few minutesDesign techniques that immediately make your visuals clearer and more persuasiveThe building blocks of storytelling with your dataHow to build teams to bring visual communication skills into your organization and cultureThis new edition of Good Charts not only provides new visuals and updated concepts but adds an entirely new chapter on building teams around the visualization part of a data science operation and creating workflows to integrate visualization into everything you do.Graphics that merely present information won't cut it anymore. Make Good Charts your go-to resource for turning plain, uninspiring charts and presentations into smart, effective visualizations and stories that powerfully convey ideas.

Bendra informacija apie: Good Charts, Updated and Expanded: The HBR Guide to Making Smarter, More Persuasive Data Visualizations Revised edition

Prekės ID: 75265247
Kategorija: Ekonomikos knygos
Prekės pakuočių kiekis: 1 vnt.
Pakuotės išmatavimai ir svoris (1): 0,03 x 0,19 x 0,24 m, 0,3 kg
Leidykla: Harvard Business Review Press
Leidinio kalba: Anglų
Tipas: Ekonomika
Pardavėjas: Minced
Autorius: Scott Berinato
Puslapių skaičius: 272
Leidimo metai: 2023

Prekių nuotraukos skirtos tik iliustraciniams tikslams ir yra pavyzdinės. Prekės aprašyme esančios video nuorodos yra tik informacinio pobūdžio, todėl jose pateikiama informacija gali skirtis nuo pačios prekės. Originalių produktų spalvos, užrašai, parametrai, matmenys, dydžiai, funkcijos, ir/ar bet kurios kitos savybės dėl savo vizualinių ypatybių gali atrodyti kitaip negu realybėje, todėl prašome vadovautis prekių savybėmis, kurios nurodytos prekių aprašymuose.

Įvertinimai ir atsiliepimai (0)

Good Charts, Updated and Expanded: The HBR Guide to Making Smarter, More Persuasive Data Visualizations Revised edition
Būkite pirmas parašęs atsiliepimą!
Šią prekę gali įvertinti tik ją įsigiję bei registruoti Pigu.lt pirkėjai.
Įvertinti prekę

Klausimai ir atsakymai (0)

Paklauskite apie šią prekę kitų pirkėjų!
Užduoti klausimą
Jūsų klausimas buvo sėkmingai pateiktas. Į klausimą bus atsakyta per 3 darbo dienas
Klausimą turi sudaryti bent 10 simbolių